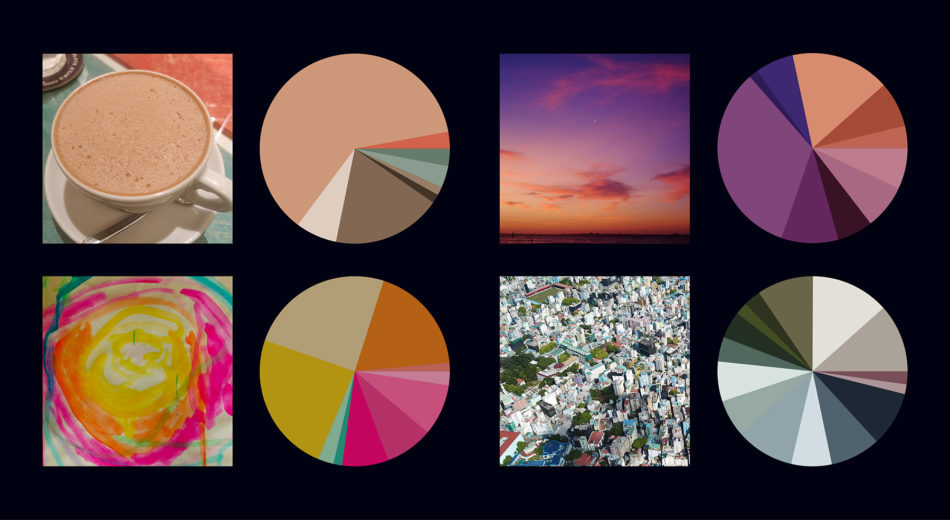
PhotoPie

Web app for colour data visualisations of photos
,

var img = new Image()
  img.onload = function () {
    var canvas = document.createElement('canvas')
    canvas.width = width
    canvas.height = width * (img.height / img.width)
    var ctx = canvas.getContext('2d')
    ctx.drawImage(img, 0, 0, width, canvas.height)
    var id = ctx.getImageData(0, 0, canvas.width, canvas.height)

Dot memorial

A personal memorial for lives lost due to covid-19
,

mport csv, json, urllib.request, datetime
from codecs import iterdecode
def main(latest):
    url =   'https://raw.githubusercontent.com/CSSEGISandData/COVID-19/'   
+'master/csse_covid_19_data/csse_covid_19_daily_reports/'
            +latest+'.csv'
    try:
        latest = urllib.request.urlopen(url)
        return generatejson(latest)
    except urllib.request.HTTPError:
        print('url not found')
        return False
def generatejson(csvfile):
    data = {}
    total = 0
    csvReader = csv.DictReader(iterdecode(csvfile, 'utf-8'))
    for row in csvReader:
        name = row['Country_Region']
        Deaths = int(row['Deaths'])    
        if name not in data:
            data[name] = Deaths
        else:
            data[name] += Deaths
        total += Deaths
    data = {k: v for k, v in sorted(data.items(), key=lambda item: item[1],reverse=True)}
    with open('data.json', 'w') as jsonfile:
        jsonfile.write(json.dumps(data))
    return total
Islands of Maldives

Islands of Maldives (aligning together)
, ,

import processing.video.*;
MovieMaker mm;
....
float x = -7000 + float(pieces[6])*100;
float y = 715 + float(pieces[7])*-100;
scale(50);
String[] shapes = split(pieces[0], ',');

beginShape();
  for (int nodes = 0; nodes < shapes.length; nodes = nodes+1) {
    String[] xy = split(shapes[nodes]," ");  
    float x1 = -7000 + float(xy[0])*100 - x+6.4;
    float y1 = 715 + float(xy[1])*-100 - y+4.0;
    vertex(x1, y1);
  }
endShape(CLOSE);
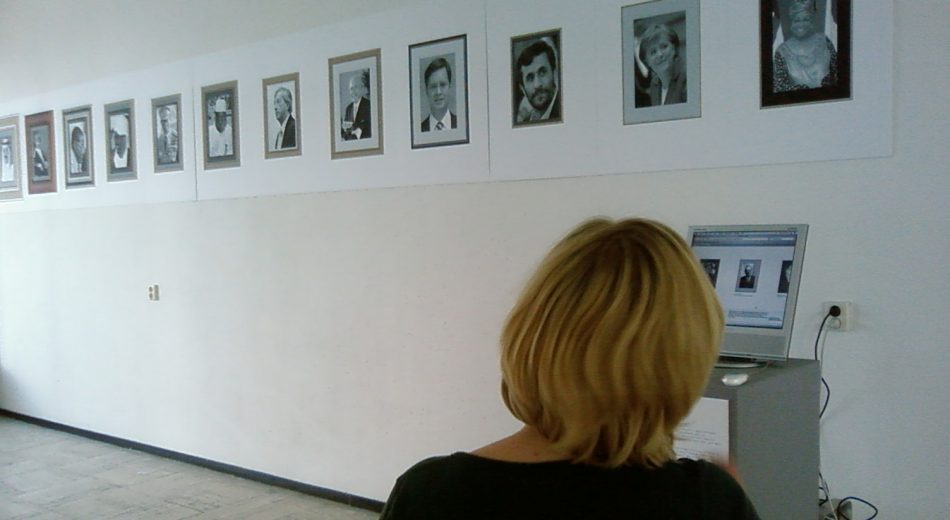
Framing Leaders

Algorithmically generated framed pictures of heads of governments
, , ,

#!/usr/bin/python
#
import datetime
for row in cursor.fetchall():
  if row['country_code'] + ".png" in srcfiles:
    x = datetime.datetime.now().date() - row['h_gov_since']
    if x.days > 365*2:
      years = " ("+ str(math.floor(x.days/365))[:-2] + " years)"
    elif x.days < 365:
      years = " ("+ str(x.days) + " days)"
      
    else:
      years = " ("+ str(math.floor(x.days/365))[:-2] + " year)" 
    img = row['country_code'] + ".png"
    imgs.append(img)
    li[img] = row['country_name'].capitalize() + years
    height.append(Image.open(pathx + img).size[1]+35)
    width.append(Image.open(pathx + img).size[0]+20)
Flags By Colours

Data visualization experiment using flags of the world
, , , ,

#!/usr/bin/python
#
from sys import argv
import Image, ImageDraw 
im = Image.open(argv[1]) 
im = im.convert('RGB') 
colors = {}; total = 0
for y in range(im.size[1]):
  for x in range(im.size[0]):
    color = im.getpixel((x,y))
    if color in colors.keys():
      colors[color] += 1
    else:
      colors[color] = 1
    total += 1 
Generator

An evolving algorithm that generates music & visuals
, ,

#!/usr/bin/python
from common import *
import random


while 1:
  num = 000
  files = ls (images, 'jpg')
  last = len(files)
  half = str(round (last/2))
  half = int(half[:half.find('.')])-3
  using = files[last-10:last]
  using.sort()
  using.reverse()
  using += files[half:half+10]