Maldives parliamentary election 2019 analysis
Data analysis of election results by sex
Computer programming, Data visualization, Research


Various data analysis and identification of patterns from publicly available data for the results of Maldives Parliamentary Election 2019.
Using Python’s pandas, numpy, matplotlib, seaborn and Processing.
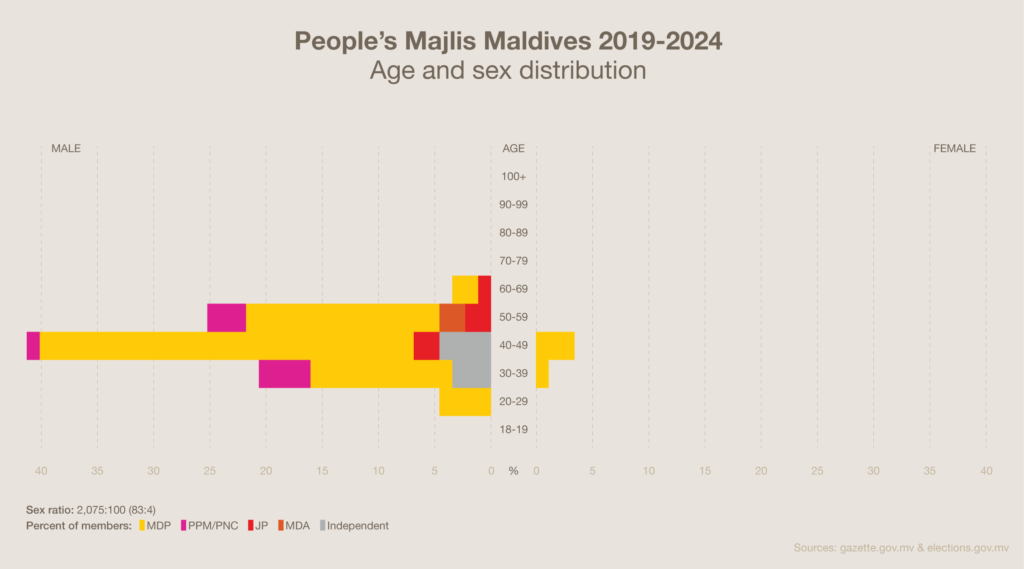
From top to bottom:
#1. Sex, age and party distribution
#2. Percentage of voters by location and sex
#3. Mean percentage of votes for the winning candidates by sex
#4. Mean percentage of votes for all candidates by sex
#5. Mean percentage of votes by party and sex
#6. Mean percentage of votes by party and sex (boxplot)
Tags: Computer programming, Data visualization, Research, Report, Social
Year: 2019